Why do you only test 2x replication!?!
There are reasons SSD guys like me usually test Ceph with 2x replication; SSDs are more reliable than spinners, performance is better with 2x, and so on. But what if you absolutely need 3x replication minimum? How does that impact performance on our super fast all-NVMe Ceph reference architecture? I’m glad you asked.
This blog is a quick performance review of our new Intel® Purley-based Ceph RA featuring our fastest NVMe drive, the Micron 9200 MAX (6.4TB).
Our new reference architecture uses Red Hat Ceph Storage 3.0, based on Ceph Luminous (12.2.1). Testing in the RA is limited to Filestore performance since that is the currently supported storage engine for RHCS 3.0.
Performance is impacted exactly as one would expect when comparing 2x replication to 3x. 4KB random write IOPS decrease by about 35%, reads stay exactly the same, and 70/30 IOPS decrease by around 25%.
Block Workloads | 2x Replication IOPS | 3x Replication IOPS | 2x Replication Average Latency | 3x Replication Average Latency |
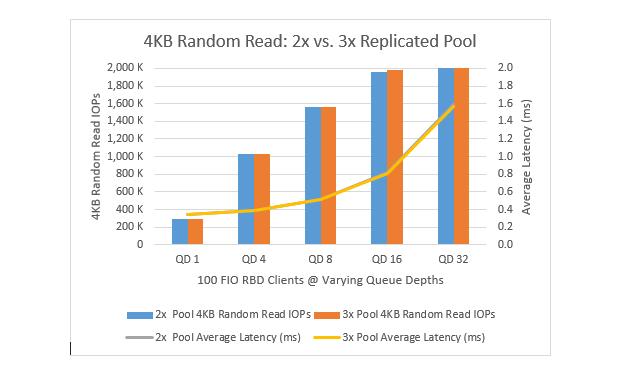
4KB Random Read | 2 Million | 2 Million | 1.6 ms | 1.6 ms |
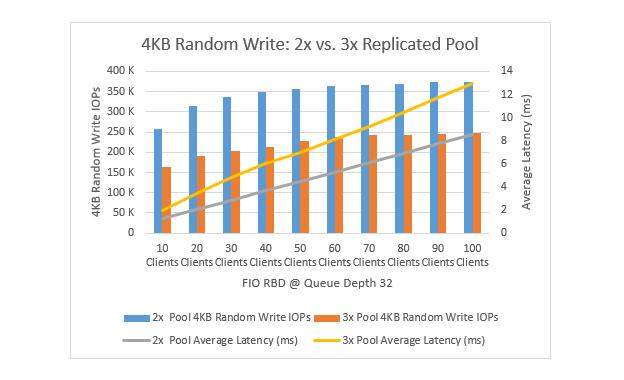
4KB Random Write | 363,000 | 237,000 | 5.3ms | 8.1 ms |
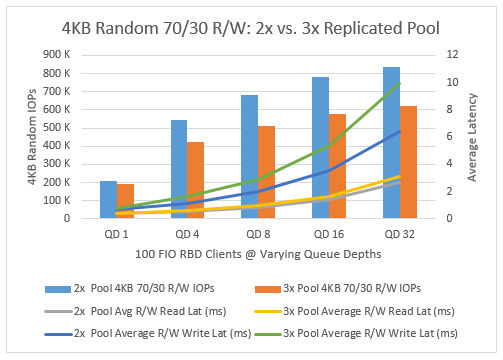
4KB 70/30 R/W | 781,000 | 577,000 | 1.4 ms read / 3.5 ms write | 1.7 ms read / 5.4 ms write |

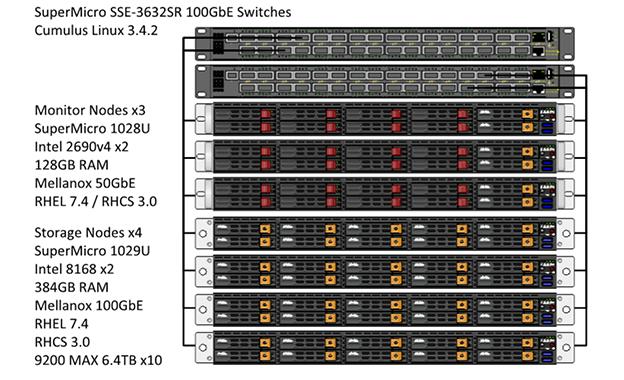
This solution is optimized for block performance. Random small block testing using the Rados Block Driver in Linux saturates platinum-level 8168 Intel Purley processors in a 2-socket storage node.
With 10 drives per storage node, this architecture has a usable storage capacity of 232TB that can be scaled out by adding additional 1U storage nodes.
Reference Design – Hardware

Test Results and Analysis
Ceph Test Methodology
Ceph is configured using FileStore with 2 Object Storage Daemons (OSDs) per Micron 9200MAX NVMe SSD. A 20GB journal was used for each OSD. With 10 drives per storage node and 2 OSDs per drive, Ceph has 80 total OSDs with 232TB of usable capacity.
The Ceph pools tested were created with 8192 placement groups. The 2x replicated pool in Red Hat Ceph 3.0 is tested with 100 RBD images at 75GB each, providing 7.5TB of data on a 2x replicated pool, 15TB of total data.
The 3x replicated pool in Red Hat Ceph 3.0 is tested with 100 RBD images at 50GB each, providing 5TB of data on a 3x replicated pool, 15TB of total data.
4KB random block performance was measured using FIO synthetic load generation tool against the Rados Block Driver.
RBD FIO 4KB Random Read Performance
4KB Random read performance is essentially identical between a 2x and 3x replicated pool.

RBD FIO 4KB Random Write Performance
With 3x replication, performance in IOPs is reduced by ~35% over a 2x replicated pool. Average latency is increased by a similar margin.

4KB write performance hits an optimal mix of IOPs and latency at 60 FIO clients, 363k IOPs, 5.3 ms average latency on a 2x replicated pool and 237k IOPS, 8.1 ms average latency on 3x. At this point, the average CPU utilization on the Ceph storage nodes is over 90%, limiting performance.
RBD FIO 4KB Random 70% Read / 30% Write Performance
The 70/30 random R/W workload IOPs performance decreases by 25% when going from a 2x replicated pool to a 3x replicated pool. Read latencies are close, slightly increased for the 3x replicated pool. Write latencies are 50%+ higher for the 3x replicated pool.

Would You Like to Know More?
RHCS 3.0 + the Micron 9200 MAX NVMe SSD on the Intel Purley platform is super fast. See the newly published Micron / Red Hat / Supermicro Reference Architecture. I will present our RA and other Ceph tuning and performance topics during my session at OpenStack Summit 2018. More on that to come. Stay tuned!
Have additional questions about our testing or methodology? Leave a comment below or you can email us ssd@micron.com.
