RocksDB is a storage focused key value database that is the backbone of many operations at Meta. Here’s their description from RocksDB.org:
"RocksDB builds on LevelDB to be scalable to run on servers with many CPU cores, to efficiently use fast storage, to support IO-bound, in-memory and write-once workloads, and to be flexible to allow for innovation.”
Meta prefers DB bench as a workload generation tool for RocksDB, as it addresses the issue of key-space localities and emulates the workloads of real-world key-value stores. This benchmark can synthetically generate more precise key-value queries that represent the reads and writes of key-value stores to the underlying storage system.
We tested the storage performance of a single device storing a 1TB database using the following data center class NVMe SSDs:
Micron 7450 SSD: Our mainstream performance drive using 176-layer TLC NAND, designed to support our cloud partners with excellent QoS and PCIe Gen4 performance.
Samsung PM9A3: A read intensive, TLC NAND, PCIe Gen4, NVMe SSD.
Solidigm D5-P5430: A mainstream, QLC based, PCIe Gen4, NVMe SSD that Solidigm is marketing in the same space as Samsung 9A3 and Micron 7450.
Test Configuration
In this blog, we discuss 3 workloads –
- Read while writing – this workload uses multiple threads for reads and just one thread for writes.
- Read random write random – it is a mix workload where multiple threads do random-read and random-write operation.
- Read random – this workload reads randomly from an existing database.
Server | Supermicro AS-1115CS-TNR |
CPU | AMD EPYC 9654 96-Core Processor |
Memory | 768GB Micron DDR5 (12x 64GB DDR5, 1DPC), Limited to 256GB in Kernel |
Filesystem | xfs |
Linux OS | Ubuntu 20.04 |
Kernel version | 5.15.0-67-generic |
RocksDB version | 8.1.1 |
DB bench version | 8.1.1 |
Performance Results
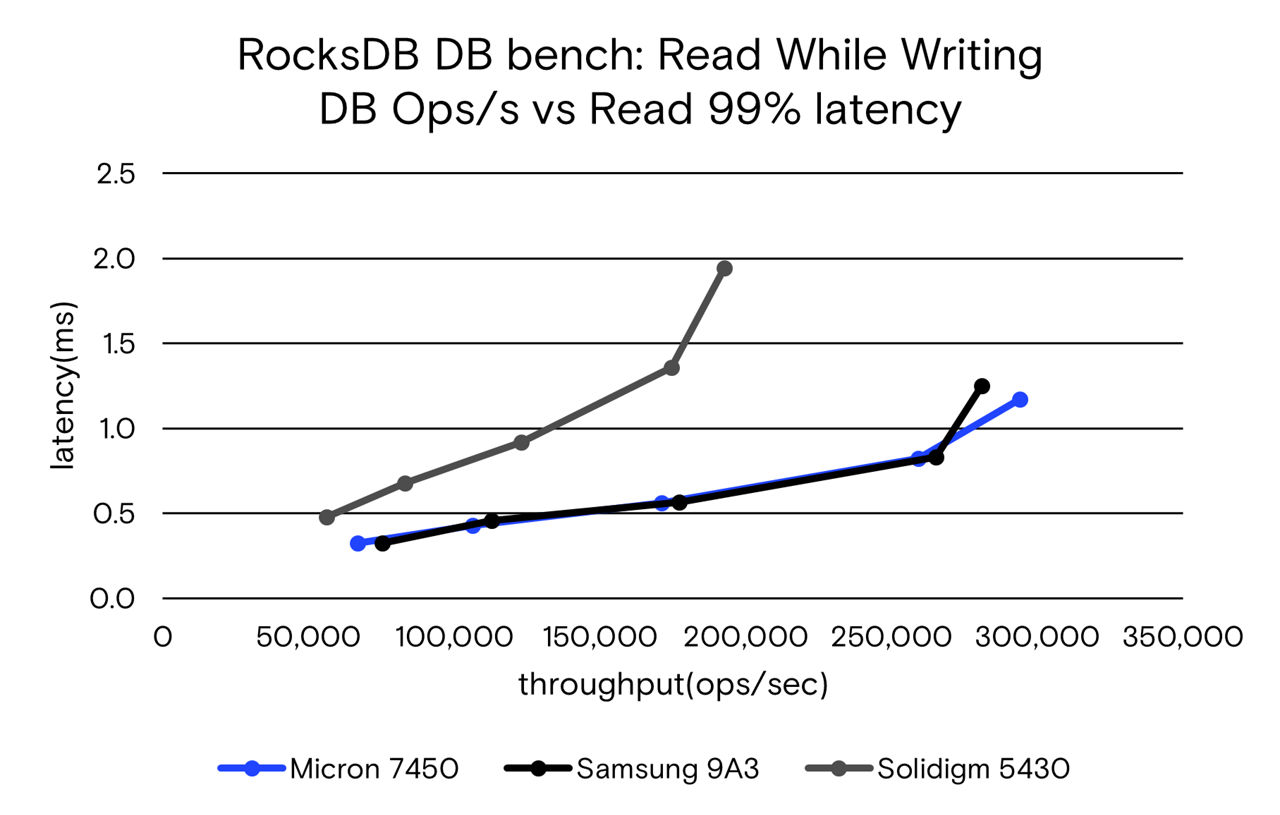
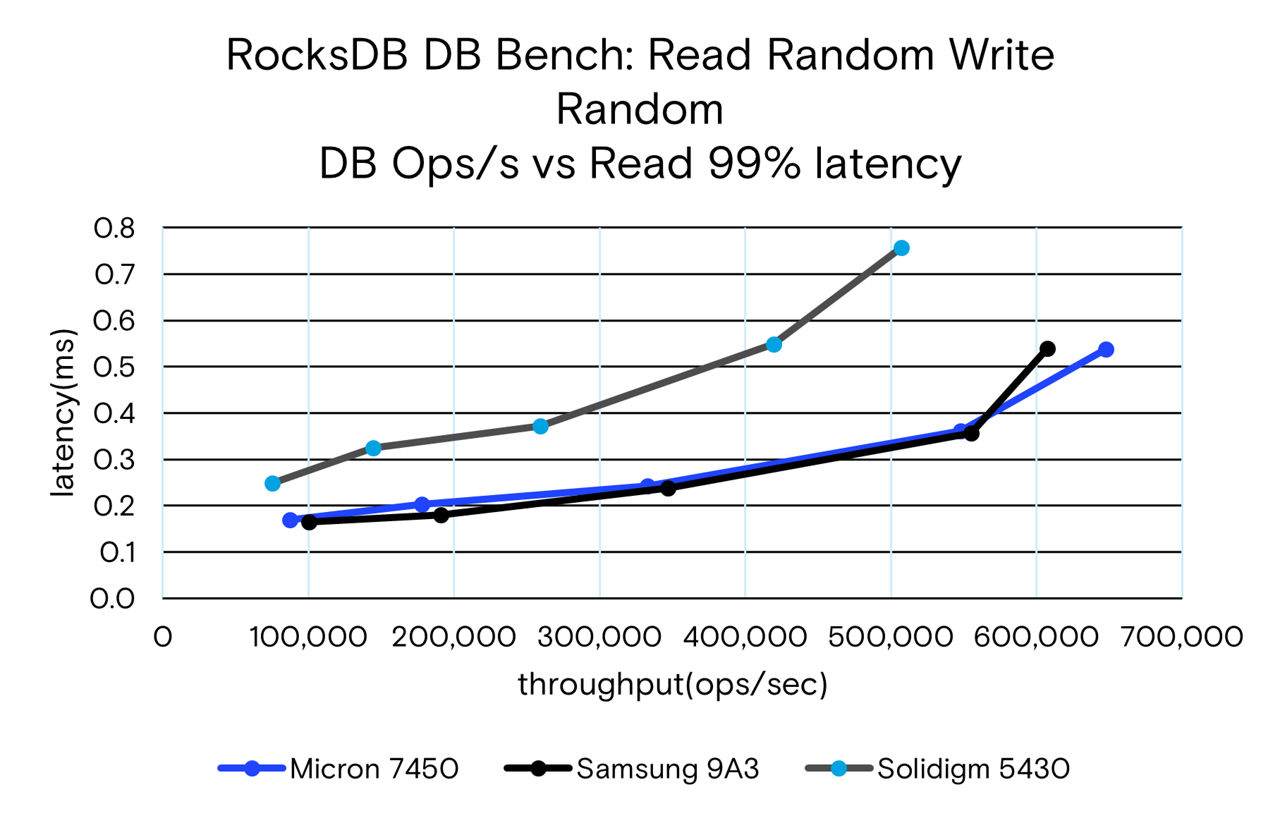
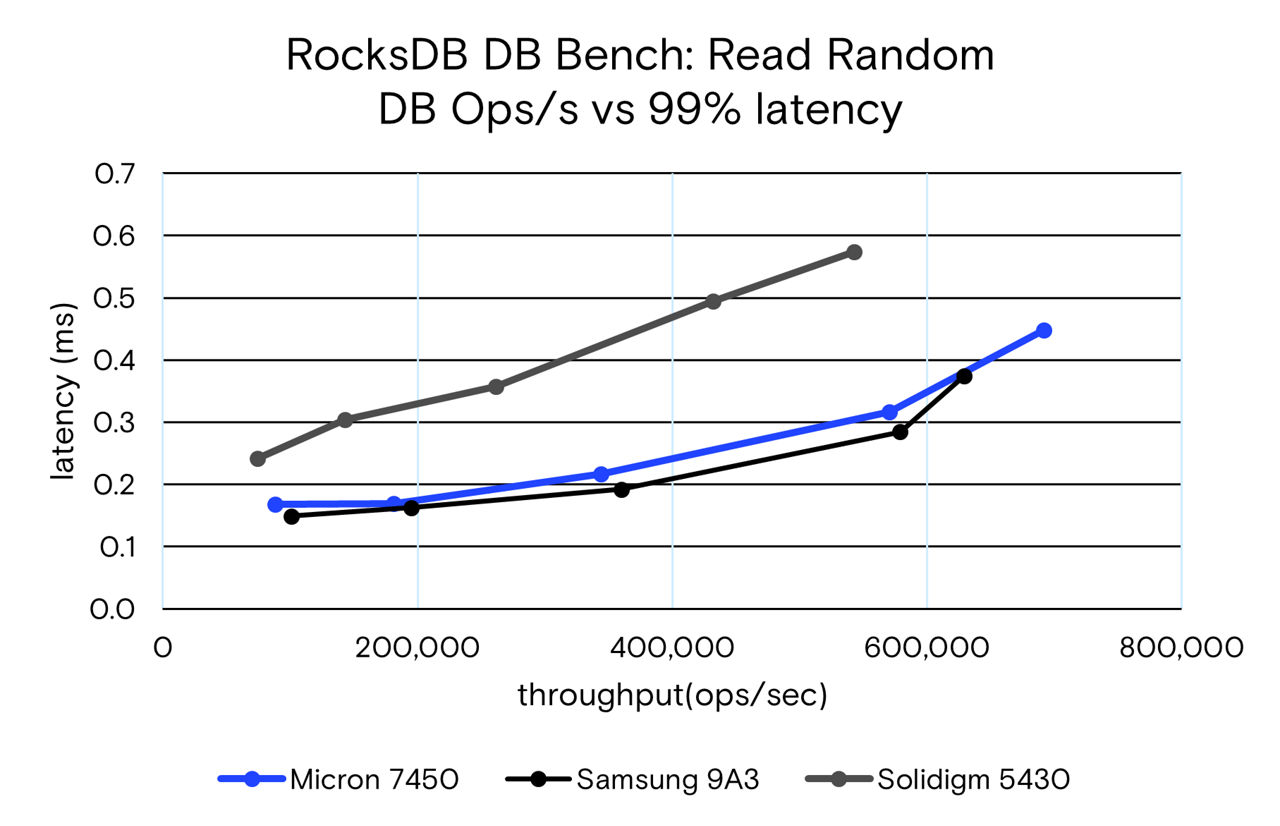
Fig.1 thru Fig.3 illustrate the 99th percentile read latency (in milliseconds) on the y-axis and the database operations per second on the x-axis for the 3 workloads. Each data point represents the average of a 20-minute run at a DB bench thread count (8, 16, 32, 64, 96).
Read while writing uses 1 write thread and scales up reads as you increase DB bench threads. The Micron 7450 and Samsung 9A3 show similar behavior at each thread count, with 7450 having better scaling at 96 threads.
The Solidigm D5-P5430 demonstrates more than double the 99% read latency and reaches a maximum ops/s that is only 65% of the other SSDs.

In the Read Random Write Random workload, the Samsung 9A3 has a slight advantage at lower thread counts, while the 7450 has the advantage at the top end. Performance is similar between these drives.
The Solidigm D5-P5430 has 1.5x the read latency and 30% lower performance (ops/s).

Finally, the Random Read benchmark again shows close performance and latency between 7450 and 9A3, with 7450 scaling higher at 96 threads and PM9A3 performing slightly better at lower threads.
The Solidigm D5-P5430 has up to 1.8x the read latency and 30% lower performance.

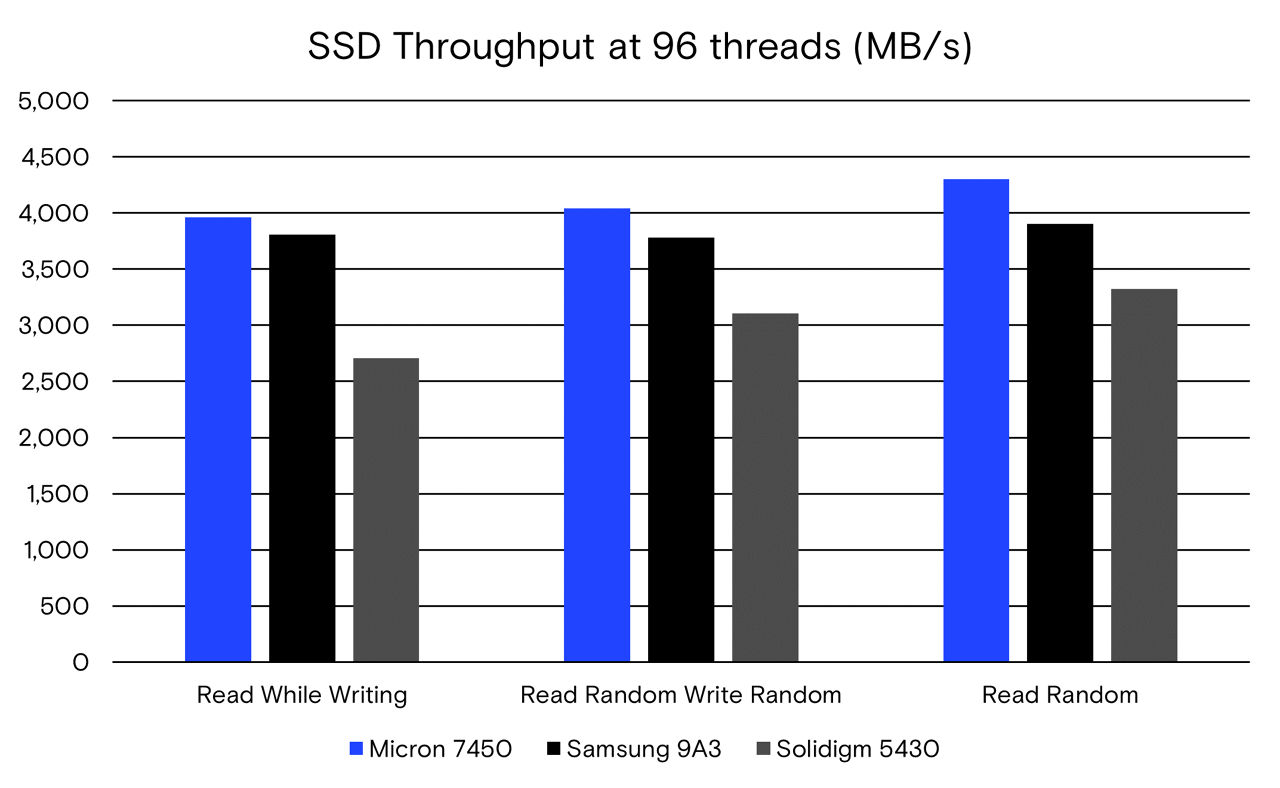
The bandwidth measurement in Fig.4 was taken for 96 thread count across the 3 workloads. Micron 7450 shows slightly higher bandwidth than Samsung 9A3 for all the three workloads whereas Solidigm 5430 has relatively lower bandwidth.

In conclusion, our analysis reveals Micron 7450 and Samsung 9A3 demonstrate comparable performance with the Micron 7450 showing a slight advantage at higher thread counts and the Samsung 9A3 has a slight advantage at lower thread counts. The Solidigm D5-P5430 consistently exhibits the lowest performance across all the workloads and thread counts, indicating it is the least performant drive in this comparative study.