Analyzing & Characterizing: AI Workloads versus MLPerf Storage
Testing storage for AI workloads is a challenging task as running actual training can require specialty hardware that may be expensive and can change quickly. This is where MLPerf comes in to help test storage for AI workloads.
Why MLPerf?
MLCommons produces many AI workload benchmarks focused on scaling the performance of AI accelerators. They have recently used this expertise to focus on storage for AI and have built a benchmark for stressing storage for AI training. The goal of this benchmark is to perform I/O in the same way as a real AI training process, providing larger datasets to limit the effects of filesystem caching and/or decoupling training hardware (GPUs and other accelerators) from storage testing.1
MLPerf Storage utilizes the Deep Learning I/O (DLIO) benchmark, which uses the same data loaders as real AI training workloads (pytorch, tensorflow, etc.) to move data from storage to CPU memory. In DLIO, an accelerator is defined with a sleep time and batch size, where the sleep time is computed from running real workloads in the accelerator being emulated. The workload can be scaled up/out by adding clients running DLIO and using message passing interface (MPI) for multiple emulated accelerators per client.
MLPerf works by defining a set of configurations to represent results submitted to MLPerf Training. Currently, the models implemented are BERT (Natural Language Processing) and Unet3D (3D Medical Imaging), and results are reported in samples per second and number of supported accelerators. To pass the test, a minimum 90% accelerator utilization must be maintained.
Unet3D Analysis
Though MLPerf implements both BERT and Unet3D, our analysis focuses on Unet3D, as the BERT benchmark does not stress storage I/O extensively. Unet3D is a 3D medical imaging model that reads large image files into accelerator memory with manual annotation and generates dense volumetric segmentations. From the storage perspective, this looks like randomly reading in large files from your training dataset. Our testing looks at the results of one accelerator vs 15 accelerators using a 7.68TB Micron 9400 PPO NVMe SSD.
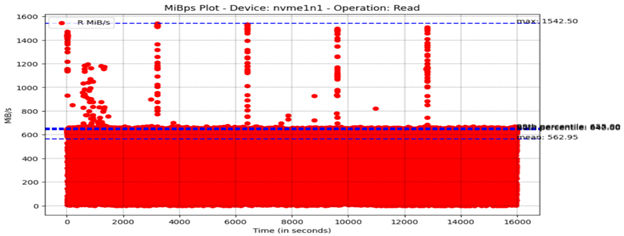
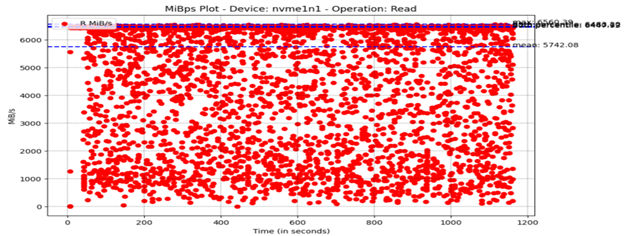
First, we will examine the throughput over time on the device. In Figure 1, results for one accelerator are measured mostly between 0 and 600MB/s, with some peaks of 1,600 MB/s. These peaks correspond to the prefetch buffer being filled at the start of an epoch before starting compute. In Figure 2, we see that for fifteen accelerators, workload still bursts but reaches the max supported throughput of the device. However, due to the burst of the workload, the total average throughput is 15-20% less than the max.
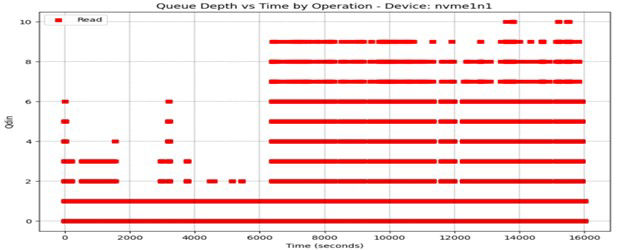
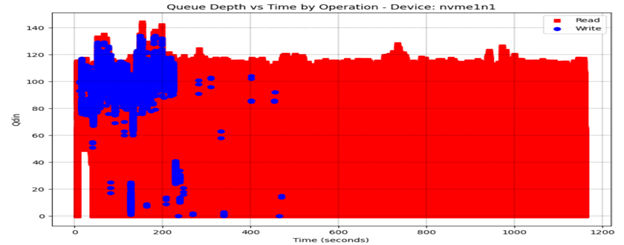
Next, we will look at the queue depth (QD) for the same workload. With only one accelerator, the QD never goes above 10 (Figure 3) while with fifteen accelerators, the QD peaks at around 145 early on, but stabilizes around 120 and below for the remainder of the test (Figure 4). However, these time series charts don’t show us the entire picture.
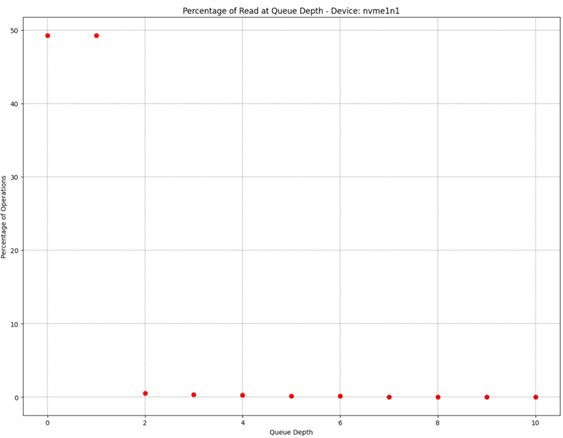
When looking at the percentage of I/Os as a given QD, we see that for a single accelerator, almost 50% of I/Os were the first transaction on the queue (QD 0) and almost 50% were the second transaction (QD 1), as seen in Figure 5.
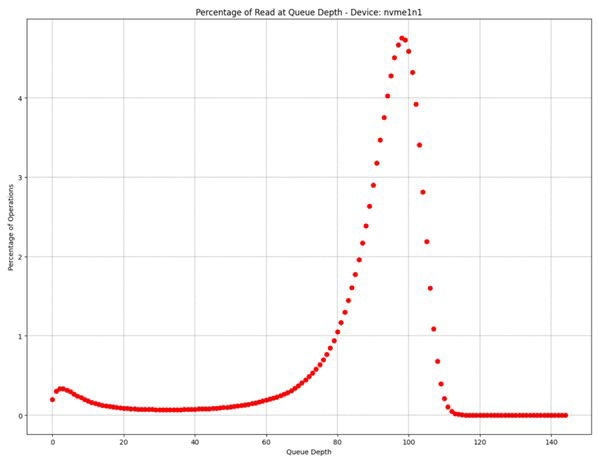
With fifteen accelerators, most of the transactions occur at QDs between 80 and 110, but a significant portion occur at QDs below 10 (Figure 6). This behavior shows that there are idle times in a workload that was expected to show consistently high throughput.
From these results, we see that the workloads are non-trivial from a storage viewpoint. Additionally, random large block transfers and idle-time mixed with large bursts of transfers and MLPerf Storage are a tool that will be extremely helpful in benchmarking storage for various models by reproducing these realistic workloads.
Reference Links
https://mlcommons.org/en/groups/research-storage/
GitHub - mlcommons/storage: MLPerf Storage Benchmark Suite
Unet3D - 1606.06650.pdf (arxiv.org)
1. See: https://mlcommons.org/en/groups/research-storage/ for additional information.

