Apache Cassandra™ is a NoSQL database that stores a vast quantity of data worldwide.1 My team recently tested Cassandra with the Micron 6500 ION, comparing its performance to a competitor QLC drive, you can find those results in our recently published technical brief.
While testing Cassandra, we used Linux NVMe tracing tools based on eBPF2 to dig into the input/output (IO) pattern of the workload as it hits the disk. What we found was insightful.
Average performance
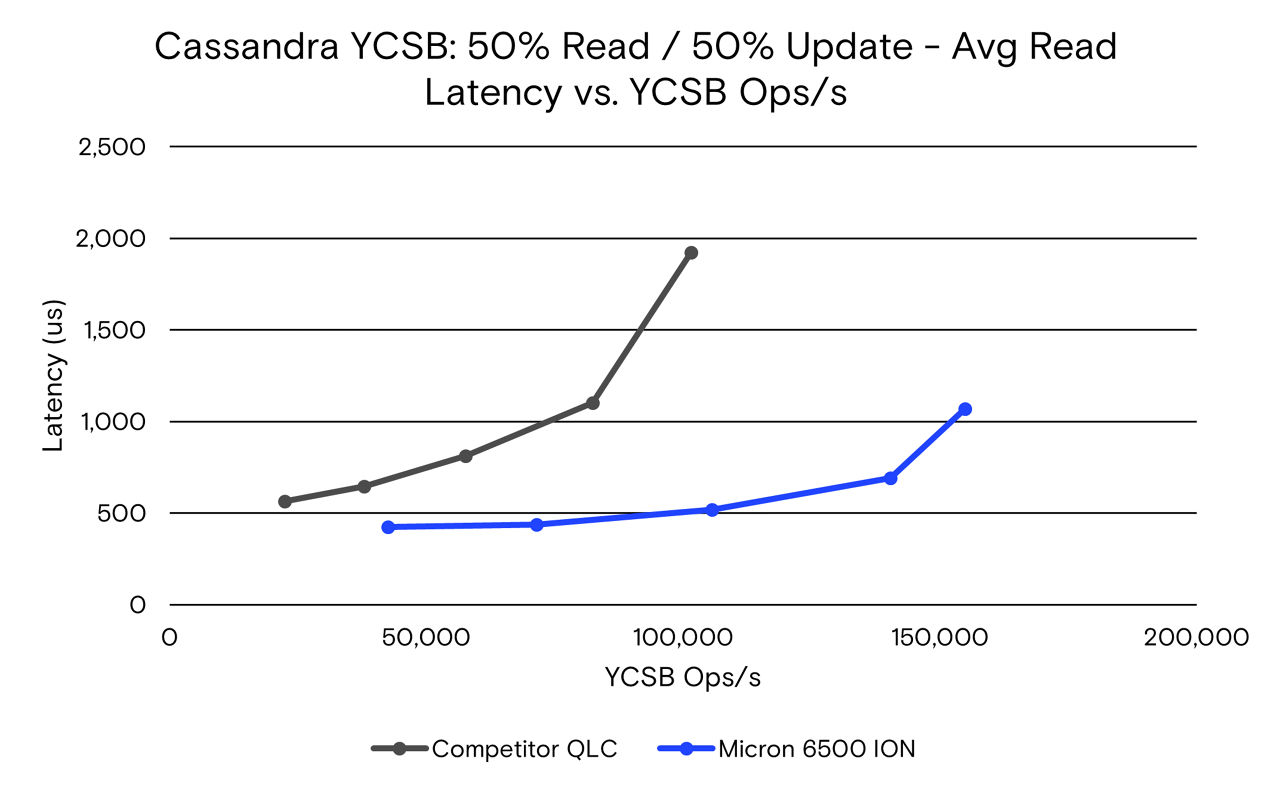
When testing applications with benchmarking tools, the results are typically shared as an average key performance indicator (KPI) over the length of a test. While valuable in giving a wide view of system scaling and performance, it doesn’t really tell the whole picture. Here’s an example from our results:This shows an impressive performance boost and reduction in quality of service (QoS) latency3 over a series of tests, scaling YCSB thread count. The data points represent the average performance of four 20-minute test runs at 8, 16, 32, 64 and 128 YCSB threads.
However, when we use standard Linux tools like iostat to look at average disk throughput, we see what appears to be very low performance.
At 32 YCSB threads, the test with Micron 6500 ION sees an average of 357MB/s reads and 136MB/s on writes. Surely NVMe SSDs are faster than that? What’s going on?
What’s going on? YCSB 50% read / 50% update at 32 Threads
From the workload trace, we captured a summary of storage device activity that gives a picture of a storage intensive workload over the 20-minute runtime:
Cassandra, YCSB 50% R / 50% U | 6500 ION |
100% 4KB | |
Total GB Read | 680GB |
Write Block Size | 74% 508KB-512KB |
Total GB written | 255GB |
Discard Block Size | 80% > 2GB |
Total GB Discard | 69GB |
%Read By IO Count | 99.6% |
% Read By Volume | 68% |
% Write by IO Count | 0.4 |
% Write by Volume | 25% |
% Discard by IO Count | 0% |
% Discard by Volume | 7% |
Block size
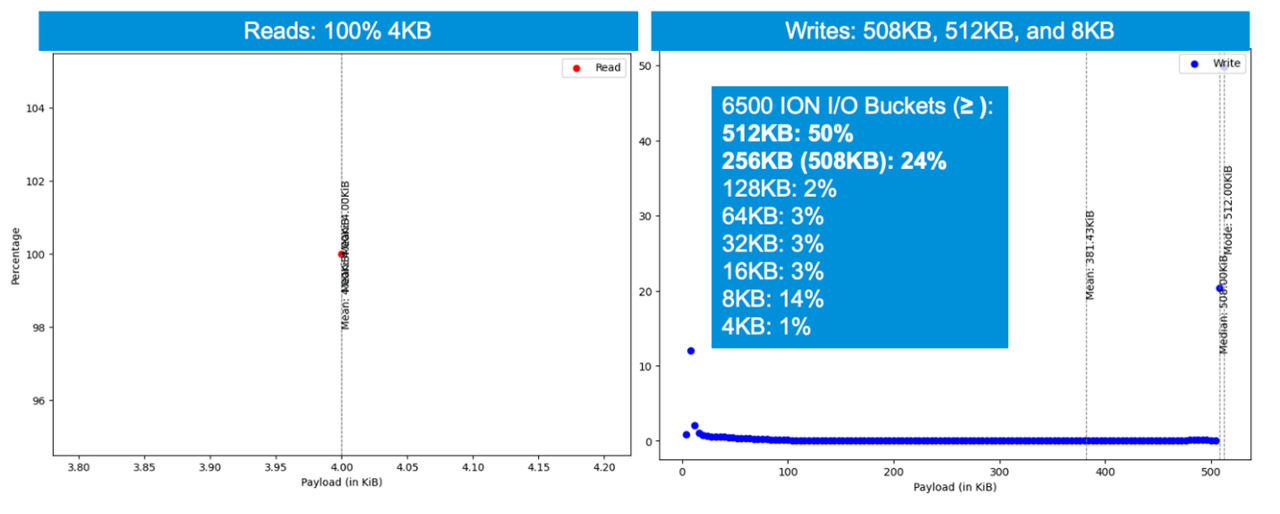
The IO size (block size) of a workload will have a dramatic effect on its performance. Here we see 100% 4KB reads, along with mostly 508KB and 512KB writes, with many smaller writes sprinkled in.
Throughput
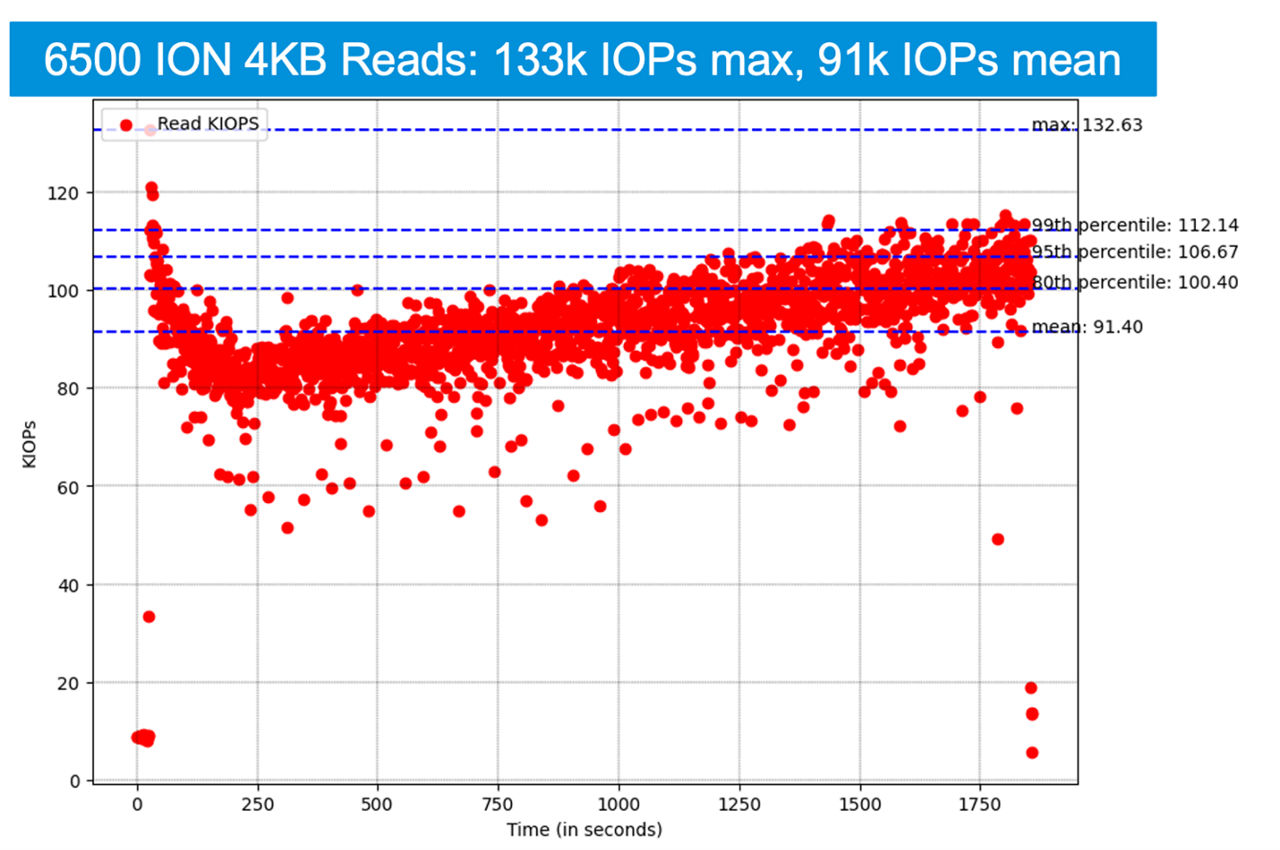
Looking at time series data, we see reads maxing out at 518MB/s, with a mean of 357MB/s, which indicates the reads are stable. The mean throughput is 91,000 input/output operations per second (IOPs), which is easy for a NVMe drive to absorb.
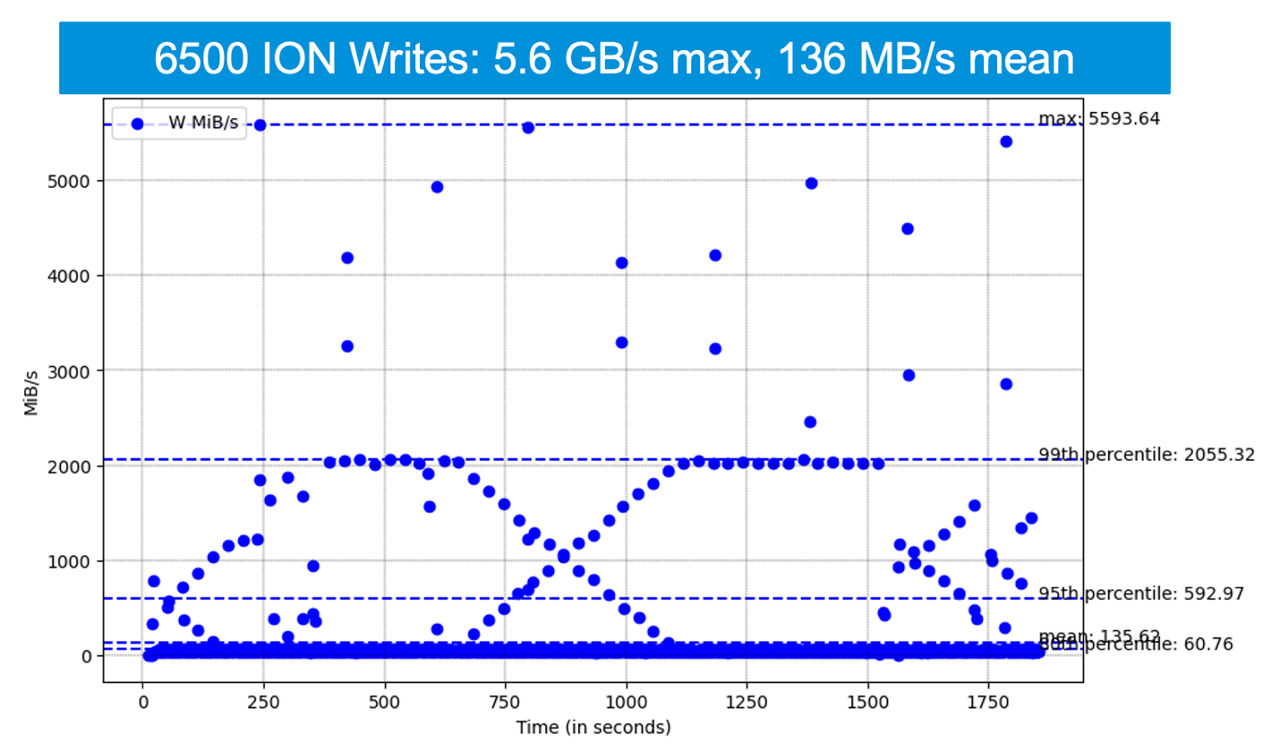
Writes are interesting because we see spikes up to 5.6GB/s, near the maximum sequential performance of the 6500 ION. The write workload for Cassandra is bursty. The main reason is the memtable flush command that offloads the updates in memory to disk and will write as fast as it can. The result is a massive difference between the burst writes at 2GB/s to 5.6GB/s over the mean throughput at 136MB/s.
Latency
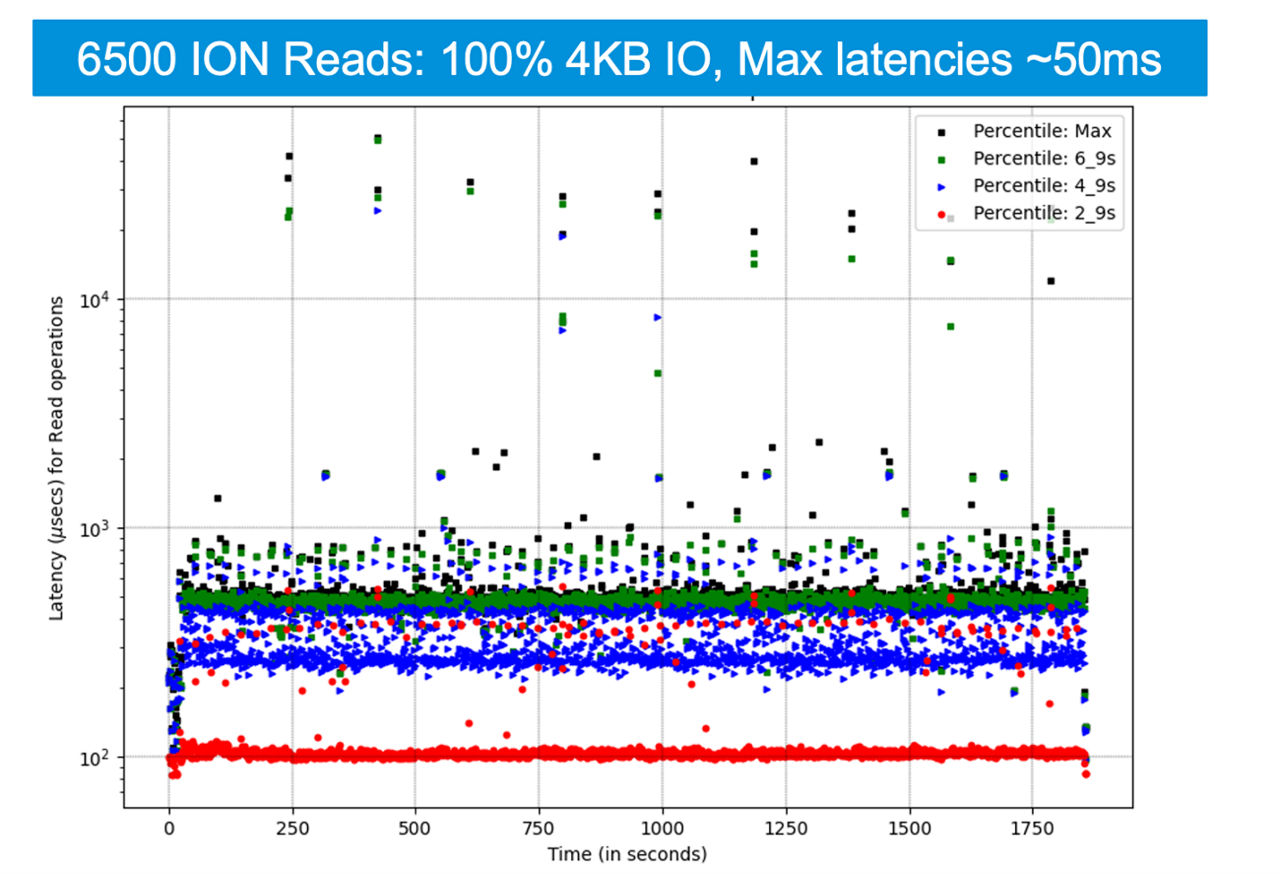
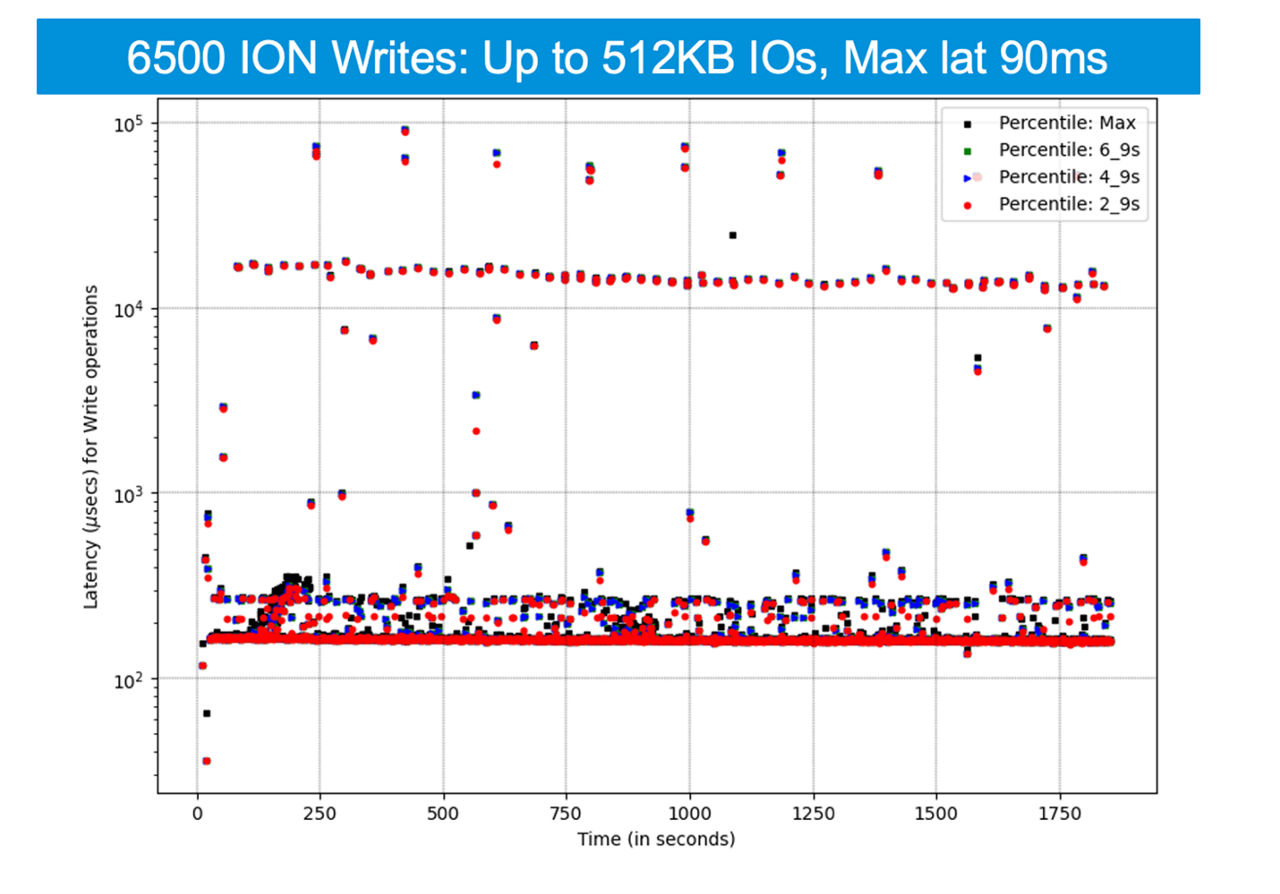
When looking at latencies, we see latency peaks at about 40ms for reads and about 90ms for writes. The results for writes make sense as there are bursts of many large IO (512KB) writes happening periodically. The reads are all 4KB, so some blocking is happening, causing the read latency to spike.
These latencies could be concerning from an SSD perspective, so we analyzed the OCP latency monitor logs in our firmware to determine that these latencies are system level. The queues are filling up fast during the memtable flush command, and the system is piling on. However, the SSD reports no latency outliers (>5ms) during this workload.
Queue depth
Finally, the queue depth seen by the system has an interesting cadence, jumping up from 20 to 200 with some large spikes to QD 800.
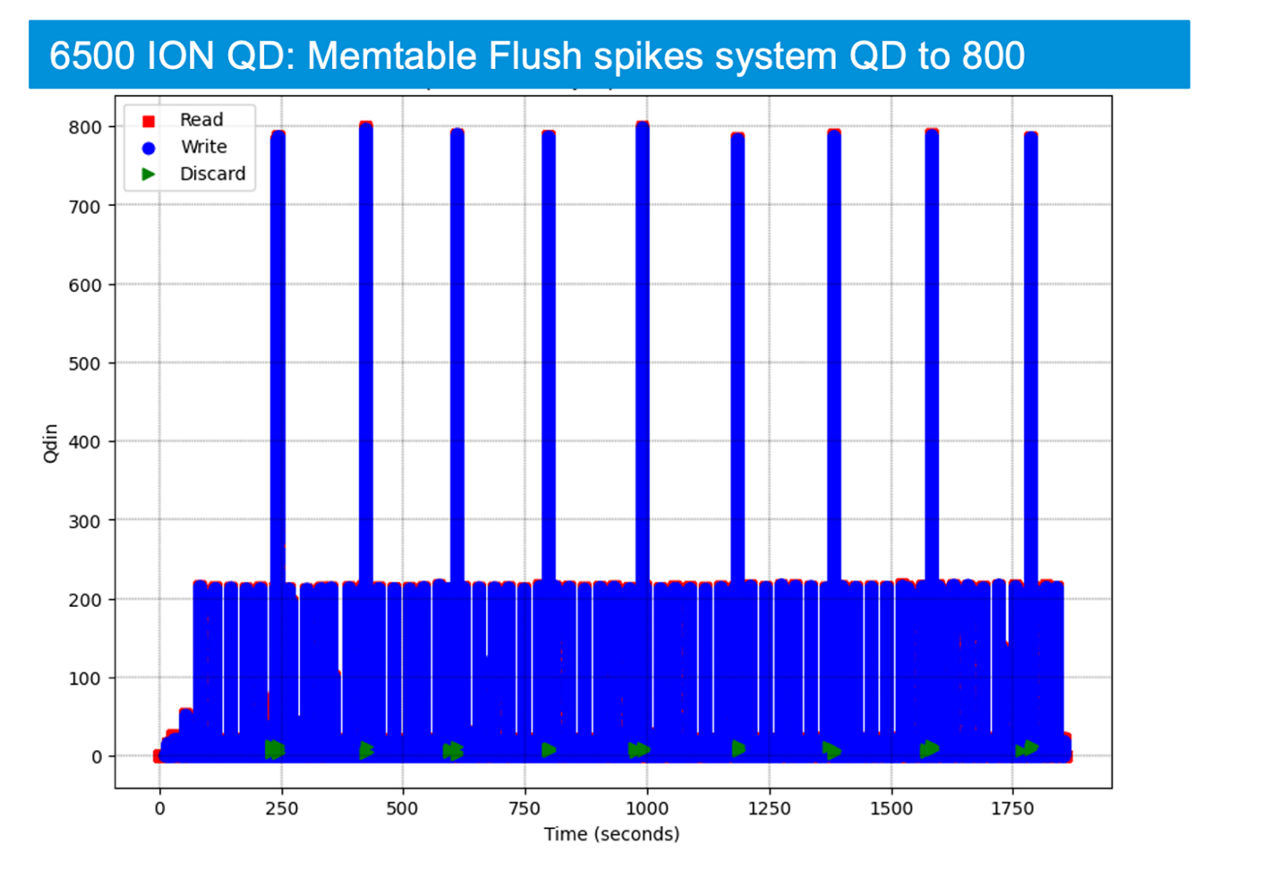
This behavior aligns with the latency effects we see from high amounts of large block writes. The memtable flush command writes a large amount of data to the disk, which causes the queue depth to grow. This high queue depth can delay some of the 4KB read IOs, causing system-level latency spikes. Once the memtable flush operation is complete, Cassandra issues a discard command to clear out the deleted data.
What did we learn?
Average application throughput, latency and disk IO give a good view to compare performance of one SSD over another or to measure the performance impact of major hardware or software changes.
Some applications, like Cassandra, may look insensitive to storage performance when analyzing the average disk IO, with low average throughput seen in tools like iostat. That misses the fact that the SSD’s ability to write large block data at high queue depth as fast as possible is critical to the performance of Cassandra. To truly understand a workload at the disk level, we have to dig past the averages.
- For additional information on Apache Cassandra, see https://cassandra.apache.org/_/index.html
- For additional information on eBPF, see https://ebpf.io/what-is-ebpf/
- Quality of service (QoS) is a common metric for describing latency consistency. See the SNIA dictionary: https://www.snia.org/education/online-dictionary/term/qos
© 2023 Micron Technology, Inc. All rights reserved. All information herein is provided on an "AS IS" basis without warranties of any kind. Products are warranted only to meet Micron’s production data sheet specifications. Products, programs, and specifications are subject to change without notice. Micron Technology, Inc. is not responsible for omissions or errors in typography or photography. Micron, the Micron logo, and all other Micron trademarks are the property of Micron Technology, Inc. All other trademarks are the property of their respective owners. Rev. A 01/2023 CCM004-676576390-11635
